
2011 MUSTANG PRODUCTION BREAKDOWN CHART
 4/2/11, 08:27 PM
#21
V6 Member

Join Date: November 1, 2009
Posts: 74
Likes: 0
Received 0 Likes
on
0 Posts
ACTUALLY HERE IS WHAT I WAS ABLE TO COME UP WITH. YOU WERE A LITTLE OFF.
21296 GT Coupes
64.90%
13821 GTs w/Man-6 Trans
18.32%
2532 GTs Man-6 Trans with 401A
9.85%
249 GTs Man-6 Trans with 401A CANDY RED
19.05%
48 GTs Man-6 Trans with 401A CANDY RED/ Brembos
33.49%
16 GTs Man-6 Trans with 401A CANDY RED/ Brembos/3:73 25.04%
4 GTs Man-6 Trans with 401A CANDY RED/ Brembos/3:73/HID
44.35%
2 GTs Man-6 Trans with 401A CANDY RED/ Brembos/3:73/HID/Comfort Package
I did not included the electronics package because I believe it is part of the 401 Spec.
Either way you must have 1 of 2 or maybe 1 of 1 made. Numbers are only off a little.
Also, I have almost the same options as your example (different axle). Plus, I have the glass roof. This would make it impossible to have even one car made.
And then my car was ordered in Canada - a much smaller market than the US. What are the odds that I got a car that only one or two other people in all of the US got?
The statitistics are interesting, however. Thanks a lot for posting.
Last edited by romendo; 4/2/11 at 08:29 PM.
 4/2/11, 09:18 PM
#22
V6 Member
Thread Starter
Join Date: February 25, 2011
Location: So-Cal
Posts: 70
Likes: 0
Received 0 Likes
on
0 Posts
Here is more food for thought. Many who have posted still seem confused so to help look at this attached 2011 MUSTANG ORDER GUIDE. If you read all the little notes you'll see what options can be had with your car or not. The Rapid Spec eliminates many of the options in your calculations because its already been included.
4/2/11, 09:20 PM
#23
V6 Member
Thread Starter
Join Date: February 25, 2011
Location: So-Cal
Posts: 70
Likes: 0
Received 0 Likes
on
0 Posts
I doesn't work this way. It is fine for GTs with manual transmission. But then you multiply that number with the percentage of cars that have the 401 package. However, this package is not limited to manual cars. It is split between manual and automatics, AFAIK.
Also, I have almost the same options as your example (different axle). Plus, I have the glass roof. This would make it impossible to have even one car made.
And then my car was ordered in Canada - a much smaller market than the US. What are the odds that I got a car that only one or two other people in all of the US got?
The statitistics are interesting, however. Thanks a lot for posting.
Actually the numbers posted are for the United States. I don't have the Canada Numbers. Look below and your be able to see more of how I know the calculations are being done correctly.
4/2/11, 09:32 PM
#24
V6 Member
Thread Starter
Join Date: February 25, 2011
Location: So-Cal
Posts: 70
Likes: 0
Received 0 Likes
on
0 Posts
OK I hate leaving things up in the air. So you guys have me working hard to prove my numbers. Here is why I believe that I'm doing this right.
Like they told us in math class keep checking your answer. So look at this attachment too:
I obviously proved that you using certain fixed numbers and more then one cell of info works and doesn't shift the numbers.
Like they told us in math class keep checking your answer. So look at this attachment too:
I obviously proved that you using certain fixed numbers and more then one cell of info works and doesn't shift the numbers.
Last edited by Bucephalus; 4/2/11 at 09:49 PM.
4/2/11, 10:44 PM
#25
Member

Join Date: January 20, 2011
Posts: 21
Likes: 0
Received 0 Likes
on
0 Posts
OK I hate leaving things up in the air. So you guys have me working hard to prove my numbers. Here is why I believe that I'm doing this right.
Like they told us in math class keep checking your answer. So look at this attachment too:
I obviously proved that you using certain fixed numbers and more then one cell of info works and doesn't shift the numbers.
Like they told us in math class keep checking your answer. So look at this attachment too:
I obviously proved that you using certain fixed numbers and more then one cell of info works and doesn't shift the numbers.
You've made a big assumption here. You've assumed that the ratio of manual to automatic remains ~60/40 regardless of package selected. That may or may not be the case.
For example:
Out of all 22k cars, ~60% are manual. What if all 400A specs were manual? Do you see what I mean? That would account for most of the the 60% of manuals, while the rest of your statistics break down completely.
Last edited by jwmurray; 4/2/11 at 10:50 PM.
4/2/11, 10:50 PM
#26
It just doesn't work this way OP. It makes for a decent estimate. But it could never be considered precise. Each step you make is an assumption and the further you assume the further you skew your data.
4/2/11, 10:56 PM
#27
Member
Join Date: January 18, 2011
Location: oklahoma
Posts: 41
Likes: 0
Received 0 Likes
on
0 Posts
27557 v6 1.95% are performance packages = 537
22.56 are black =121
29.96 rapid spec 101a =36
#s could be wrong but 1.95% is lower than gt 500 convertable # makes m wonder the future value of performance package cars (will they be cloned)
i remember v6 buyers being dogged on here for there purchases
resale values for low production optioned cars historicaly have been high
no wonder it is hard to find a performance packag 2011 for sale
4/2/11, 11:42 PM
#28
V6 Member
Thread Starter
Join Date: February 25, 2011
Location: So-Cal
Posts: 70
Likes: 0
Received 0 Likes
on
0 Posts
You've made a big assumption here. You've assumed that the ratio of manual to automatic remains ~60/40 regardless of package selected. That may or may not be the case.
For example:
Out of all 22k cars, ~60% are manual. What if all 400A specs were manual? Do you see what I mean? That would account for most of the the 60% of manuals, while the rest of your statistics break down completely.
For example:
Out of all 22k cars, ~60% are manual. What if all 400A specs were manual? Do you see what I mean? That would account for most of the the 60% of manuals, while the rest of your statistics break down completely.
I'm not trying to break down every possible combination for everyone. I was looking for the number of my vehicle originally. Others wanted to know how I was doing this. By plugging in the knows (%) and totals which FORD GAVE ME and doing what they told me to do to find my answers, I'm very confident that the numbers are 98% accurate.
The other part of the equation is for the reader who is calculating their car from this chart must have knowledge of mathematics and know what they are looking for.
As a matter of fact, I challenge anyone to prove my own car's calculation wrong based on the chart and it's data. The logic is easy to follow.
5.0 Coupes = 21296
6-Speed = 13821
300 A = 1873
Brembo = 357
3;73 = 120
Black = 36
I'll be waiting.
Last edited by Bucephalus; 4/2/11 at 11:44 PM.
4/2/11, 11:48 PM
#29
Member
Join Date: January 20, 2011
Posts: 21
Likes: 0
Received 0 Likes
on
0 Posts
As a matter of fact, I challenge anyone to prove my own car's calculation wrong based on the chart and it's data. The logic is easy to follow.
We can't. You don't want to listen. It's not a big deal, though. Nothing to get upset about.
We can't. You don't want to listen. It's not a big deal, though. Nothing to get upset about.
4/2/11, 11:54 PM
#30
You can keep waiting. It's not worth my time. If you want to believe you are right then go right ahead.
Thanks for sharing the information Ford gave you. It is very interesting for sure.
Thanks for sharing the information Ford gave you. It is very interesting for sure.
4/2/11, 11:57 PM
#31
V6 Member
Thread Starter
Join Date: February 25, 2011
Location: So-Cal
Posts: 70
Likes: 0
Received 0 Likes
on
0 Posts
I'm not upset. Just asking you or someone else to do what I'm doing. Criticism is fine and everyone has an opinion. However, not everyone is using a calculator to back up the facts. That's all I'm trying to do.. For me its all fun in games.
Make me an illustrated example from the chart and maybe I could follow what your trying to say to me. Don't just take hypotheticals and throw them out there.
Last edited by Bucephalus; 4/3/11 at 12:01 AM.
4/3/11, 12:04 AM
#32
Member
Join Date: January 20, 2011
Posts: 21
Likes: 0
Received 0 Likes
on
0 Posts
I'm not upset. Just asking you or someone else to do what I'm doing. Criticism is fine and everyone has an opinion. However, not everyone is using a calculator to back up the facts. That's all I'm trying to do.. For me its all fun in games.
Make me an illustrated example from the chart and maybe I could follow what your trying to say to me. Don't just take hypotheticals and throw them out there. Please some one , show me I'm right or wrong. So I can finally know what the production numbers of my car are.
Make me an illustrated example from the chart and maybe I could follow what your trying to say to me. Don't just take hypotheticals and throw them out there. Please some one , show me I'm right or wrong. So I can finally know what the production numbers of my car are.
Last edited by jwmurray; 4/3/11 at 12:14 AM.
4/3/11, 12:14 AM
#33
Legacy TMS Member Moderator
I have no interest in proving that you are wrong because there is insufficient data to prove either way. In other words, you have not come close to proving your assertions that there were 36 black cars that matched your other options or that there were 120 cars that matched all your options regardless of paint, and right up the line.
A proof of a method requires it to work regardless of the inputs. So I will prove your method does not work with this hypothetical example:
If 50% of all 2011 Mustangs were 301As and 50% were black. All you can know about the combination of black 301As is that there could be as few as NONE or as many as 50% of total production. At one extreme half the total cars could be black NON-301As and the other half NON-black 301As. In other words there does not have to be a single black 301A. At the other extreme, every 301A could be black, in which case 50% of all cars would be black 301As.
The PDF that you posted is extremely useful and interesting, and I thank you for it. It just can't be used to determine counts for combinations of attributes.
Last edited by HoosierDaddy; 4/3/11 at 12:16 AM.
4/3/11, 12:19 AM
#34
V6 Member
Thread Starter
Join Date: February 25, 2011
Location: So-Cal
Posts: 70
Likes: 0
Received 0 Likes
on
0 Posts
I'll try to explain again then. You're assuming that all of these variables are independent. They may or may not be. For example, more than 65% of black cars may be manuals. The error in your chart is in the section where you multiply the different rapid specs by .35 (auto) and .65 (manual). Ford gave you these percentages across all of a given trim level (GT coupe). They did not say that 65% of black cars are manuals. This is the error you made. If you don't agree, that's fine. I don't care.
So use this on your car if its a 2011 GT:
1) Total Coupes
2) Type of Transmission
3) Rapid Spec
4) Brembo Option
5) Gears
6) Color
THE ANSWER
MY MUSTANG BREAKDOWN
5.0 Coupes : 21,296
6-Speed: 13,821 (64.90%)
300 A Rapid Spec: 1,873 (13.55%)
Brembo Package : 357 (19.05%)
3:73 Gears: 120 (33.49%)
Black : 36 (30.40%)
Ford's Percentages work across the GT Coupe Line as a whole and as for an individual car. Even if you mix up the order. The Key is to remember is that "the percentage" never changes. It remains the same. It is the same constant, as well as the total number of Mustangs GT Coupes at 21,296. HOWEVER, YOU MUST WORK THE MATH ALL THE WAY THROUGH to the right...DO NOT STOP MIDWAY! If you do that is when the mistakes start to happen.
Try it! It works!!! Check out this math work below or attached. I did in it excel. I hope that brings any doubts to a conclusion.
Last edited by Bucephalus; 4/3/11 at 01:51 AM.
4/3/11, 07:51 AM
#35
Bullitt Member

Join Date: September 21, 2009
Location: Ontario, Canada
Posts: 346
Likes: 0
Received 0 Likes
on
0 Posts
^ you're just using the same numbers in a differant combination...when it comes to combinations..order does not matter, you'll always get the same answer (basic statistics)
These guys are telling you exactly why your estimates are not true...but you're not listening lol...from the data you can't assume that just because a car is black and a coupe, that it is a manual...you can assume 2 things...but after assuming those 2 things...that data doesn't work...every variable is independent or each other.
But from that data im able to figure out that im 1 of 36 sterling grays in Canada
only because the 3.55 option was only availible for Canadian verts...so by that im able to find that there were 503 convertible GT's sold in Canada...of those 503, 36 were sterling grey
Last edited by LLZuB; 4/3/11 at 08:49 AM.
4/3/11, 07:54 AM
#36
GT Member
Join Date: March 3, 2011
Location: Edmonton, Alberta
Posts: 112
Likes: 0
Received 0 Likes
on
0 Posts
Originally Posted by Bucephalus
The Key is to remember is that "the percentage" never changes. It remains the same. It is the same constant,
This is where you are making a jump in logic some of us are having a hard time following. Those percentages are given for the total production run. There is nothing to say they are consistent across the options. At best they could be considered a trend once you get past the overall production #'s.
4/3/11, 10:03 AM
#37
Tasca Super Boss 429 Member
Join Date: November 14, 2007
Location: Pacific NW USA
Posts: 3,652
Likes: 0
Received 8 Likes
on
6 Posts
You've made a big assumption here. You've assumed that the ratio of manual to automatic remains ~60/40 regardless of package selected. That may or may not be the case.
For example:
Out of all 22k cars, ~60% are manual. What if all 400A specs were manual? Do you see what I mean? That would account for most of the the 60% of manuals, while the rest of your statistics break down completely.
For example:
Out of all 22k cars, ~60% are manual. What if all 400A specs were manual? Do you see what I mean? That would account for most of the the 60% of manuals, while the rest of your statistics break down completely.
+1. The OP's logic is flawed in how to apply the percentages. I've looked at these reports for the past 12 years. It shows take rates of individual options that aren't the same for for each option elsewhere in the chart.
The OP's math is flawed, too, by trying to "prove" his math by simple changing the order in which he multiplies the percentages. That is simply the distributive property of math at work. Any math major can see that and know that the numbers will work out the same each time - it's the original logic that is flawed.
Here is the last nail in the coffin for the OP's theory. We all know that all 11 GT Automatics came with 3.15 gears. Note that the chart shows the take rate of automatics (for GT Coupes) at 35.10%. Note that the take rate of 3.15 gears (fo GT Coupes) is also 35.10%. By the OP's logic, the take rate of 3.15 gears would have to be 100% since all 3.15 gears went to cars with the automatic. Since it shows 35.10% for both options, we know that the take rate percentages shown are independent of the take rates of all other options on the chart!
Need another example? Within the GT Coupe column, the Brembo Package take rate is 19.05%. There is only one tire available with that package - the Pirelli 255/40/19 - which also has a 19.05% take rate on the chart. You can't simply multiply the two numbers together, otherwise the "math" would say that just 3.6% of GT Coupes came with the Brembo Package and the 255/40/19 tires, which we all know is wrong!
Sorry to be the bearer of bad news, OP. However, I'm sure that you and I still have fairly rare cars.
Last edited by Five Oh Brian; 4/3/11 at 10:22 AM.
4/3/11, 10:31 AM
#38
Tasca Super Boss 429 Member
Join Date: November 14, 2007
Location: Pacific NW USA
Posts: 3,652
Likes: 0
Received 8 Likes
on
6 Posts
Couldn't help but notice the chart says 68,650 2011 Mustangs were built. My VIN # is over 69,000 and we saw VIN #''s just past 70,000. I wonder if the 68,650 is just USA-bound sales? Or perhaps 1,400 or so VIN #'s were skipped or weren't used (cancelled orders???).
4/3/11, 10:33 AM
#39
Bullitt Member
While it would be VERY COOL if we could use this chart to determine how many cars are exactly like our own, unfortunately it doesn't work.
Linelock/LLZub/HoosierDaddy/Lance/etc are all correct.
Your spreadsheet is assuming each category is a subset of the category above it, which is incorrect.
OK sure I'll play.
In mathematical terms, you're assuming mutual exclusivity. This is when if a value is X, it cannot be Y.
The values inside of the main categories are mutually exclusive (eg if you have a 6-speed transmission, you cannot have an automatic. You can only have one or the other).
However the mutual exclusivity is not transferable outside of the categories. If you have a 300A, it has no affect whether you have a 6-speed or auto, or if you have Brembo or non-Brembo.
Having a 300A only means that you cannot have a 400A or 401A.
Here's a concrete example using the same method you used, but way less data (no way I'm going to spec out 21 THOUSAND different cars).
Let's assume only 20 coupes were produced. Here's the stats.
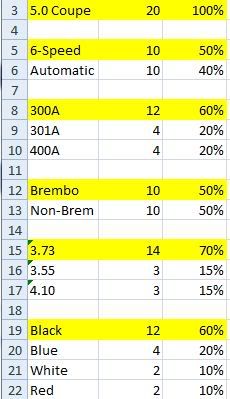
OK now I'll use the same method you used of calculating your car.
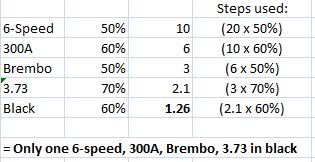
So using your same spreadsheet, there's only 1 car like this.
But really, there is TEN.
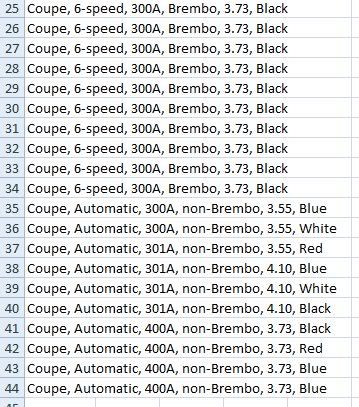
As you can see, the data fits the percentage specifications.
But since the data isn't mutually exclusive, you can't use your method of calculating how many cars like yours exist.
PS. I'm not trying to be a ****, just wanting to show why the math doesn't work
Linelock/LLZub/HoosierDaddy/Lance/etc are all correct.
Your spreadsheet is assuming each category is a subset of the category above it, which is incorrect.
In mathematical terms, you're assuming mutual exclusivity. This is when if a value is X, it cannot be Y.
The values inside of the main categories are mutually exclusive (eg if you have a 6-speed transmission, you cannot have an automatic. You can only have one or the other).
However the mutual exclusivity is not transferable outside of the categories. If you have a 300A, it has no affect whether you have a 6-speed or auto, or if you have Brembo or non-Brembo.
Having a 300A only means that you cannot have a 400A or 401A.
Here's a concrete example using the same method you used, but way less data (no way I'm going to spec out 21 THOUSAND different cars).
Let's assume only 20 coupes were produced. Here's the stats.
OK now I'll use the same method you used of calculating your car.
So using your same spreadsheet, there's only 1 car like this.
But really, there is TEN.
As you can see, the data fits the percentage specifications.
But since the data isn't mutually exclusive, you can't use your method of calculating how many cars like yours exist.
PS. I'm not trying to be a ****, just wanting to show why the math doesn't work
Last edited by SD6; 4/3/11 at 10:41 AM. Reason: Added a PS at the end.
4/3/11, 11:21 AM
#40
Here's my breakdown. Since the OP's method is flawed, the best you can do is identify the trim level of your car, then based on the number of cars produced, calculate how many vehicles in that trim level had a particular option.
GT Coupe: 1 of 21,296
6-speed Manual: 1 of 13,821
Kona Blue Metallic: 1 of 2,781
Black/Cashmere interior: 1 of 2,855
Spoiler delete: 1 of 6,331
3.73 rear axle: 1 of 7132
Brembo brake package: 1 of 4,184
Security package: 1 of 10,956
Comfort package: 1 of 9,444
HID headlamps: 1 of 5,332
I was surprised how many GT coupes had the spoiler delete option. More than I thought.