
Stock 2011GT vs. 2011 GT500 vs. 2012 Boss HP curves

Thread Starter
Bullitt Member
Joined: April 10, 2011
Posts: 240
Likes: 0
From: So. NH
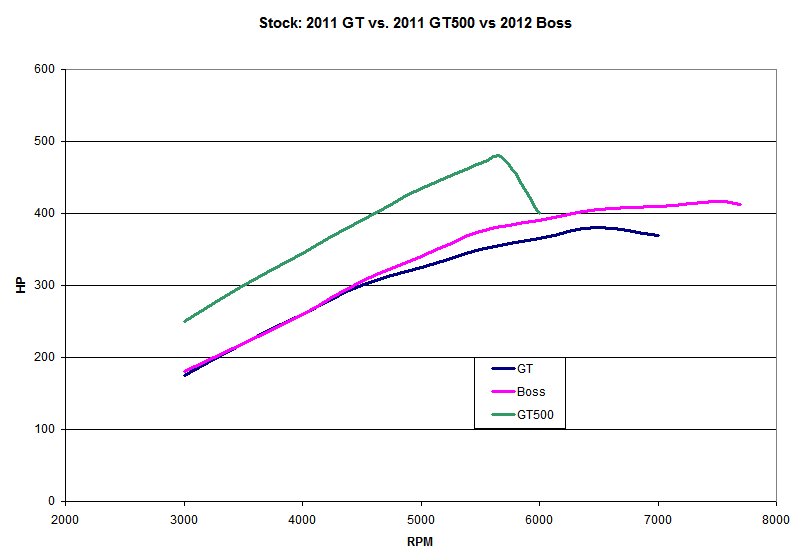
Stock 2011GT vs. 2011 GT500 vs. 2012 Boss HP curves
I combined some data in Excel so I could look at the basic shape of the HP curves of these three engines. The numbers are from the more optimistic Dynojet curves I've found while searching. I used 2 2011 GT and 2 2011 GT500 curves, but just the one Boss curve from Insideline.com. I didn't feel like doing the torque curves 
Thread Starter
Bullitt Member
Joined: April 10, 2011
Posts: 240
Likes: 0
From: So. NH

Cobra R Member
Joined: January 4, 2011
Posts: 1,811
Likes: 0
Originally Posted by BOSS_man
It's amazing to see a HP curve just flatten out and stay at peak power over such a broad RPM range. Look at the Evolution Performance curve - car just sits at peak power from 6200 RPM to 7700 RPM - you just don't see HP curves like this very often.

Thread Starter
Bullitt Member
Joined: April 10, 2011
Posts: 240
Likes: 0
From: So. NH
I agree & consider the Evolution a "raised" version of the stock curve, albeit with an offset that makes comparison to the dynojet numbers difficult. Also, not sure it it's a property of the Mustang Dyno or the averaging of the curve, but the "flat" is easier to see on the Evolution curve.
Cobra R Member
Joined: January 4, 2011
Posts: 1,811
Likes: 0
Originally Posted by BOSS_man
I agree & consider the Evolution a "raised" version of the stock curve, albeit with an offset that makes comparison to the dynojet numbers difficult. Also, not sure it it's a property of the Mustang Dyno or the averaging of the curve, but the "flat" is easier to see on the Evolution curve.

But I would like to see other dyno results of other Boss owners.
Thread Starter
Bullitt Member
Joined: April 10, 2011
Posts: 240
Likes: 0
From: So. NH

Thread
Thread Starter
Forum
Replies
Last Post
MRGTX
2012-2013 BOSS 302
12
Aug 7, 2015 08:29 AM
tdf017
General Mustang Chat
6
Aug 5, 2015 10:13 AM